Mirage — An Agentic Chip Design Case Study
Mirage is an open-source Transformer accelerator for real-time EN↔AR translation on one of the smallest Zynq parts sold — a machine-translation engine that has to fit in 66 DSP slices. This page is about the agent loop that carries its design program: it audits the upstream RTL, drafts what's missing, and closed 19 of 19 plan tasks through a gate that only believes files on disk.
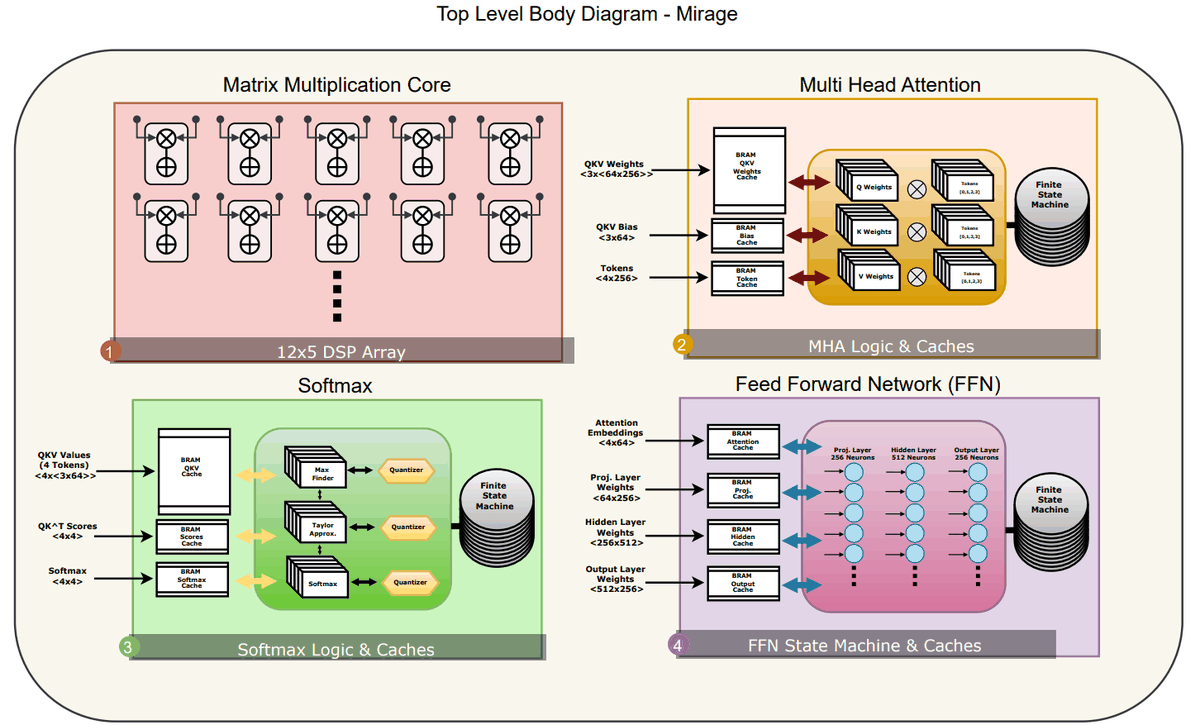
Mirage/images/mirage-top-level-bd.png): the four cores the plan's audits and drafts land in.01 The problem
The silicon constraint: a 6-layer, 256-dim encoder has to run on an
XC7Z007S — 66 DSP48E1 slices, ≈225 KB of BRAM — so one physical
encoder layer must stand in for all six. Pre-synthesis, the multiplier budget
looks like this:
reports/w11-resource-map.md). The W11 task's <90% acceptance bar expects this to fail; the documented fallback time-multiplexes the gemm tile as 2×30. One free multiplier is the entire margin for error.The other constraint is trust: a chip is a long chain of decisions where a week-3 arithmetic error quietly poisons week 9. So every task is gated on evidence, and every claim below carries its evidence tier — nothing here ran on silicon.
02 Architecture
Two architectures share this project: the harness that does the engineering, and the datapath being engineered. The agent occupies exactly one box.
The harness
◂ swipe to pan the diagram ▸
data · artifacts control · gate checks purple = the agent dashed outline = agent-drafted
workflow/, harness/hooks.py). Briefs come from the state file, evidence from ghdl and spec-first goldens; completion is decided by a gate that reads the disk, not the transcript.All node notes (text version)
- spec/mirage-mvp-spec.md
- The mission and exit bar, written before any RTL was touched — the agent is held to a standard it did not choose.
- 19-task plan
- Parsed from the spec by
workflow/parse.pyinto stable task IDs, each with acceptance criteria, declared artifacts, and a risk note. - spec/mirage.state.json
- 59 nodes; the single source of truth for progress. Every number on this page traces to this file or a report it points at.
- workflow.cli
- status · next · show · start · complete · block; every reply capped at ~500 tokens.
- artifact gate
- Refuses with exit 2 unless every declared artifact exists on disk;
--forceis human-only and was never used. - Kimi K3 agent
- Plans, writes Python golden models, drafts and repairs VHDL; finds out whether it succeeded from exit codes.
- scope guards
- Pre-tool hooks block writes into the read-only Mirage submodule, plus rm -rf, git push, curl-pipe-bash.
- ghdl
- Analyze, elaborate, run — catches VHDL that will not build; surfaced the week-7 FFN compile blocker.
- goldens
- Bit-accurate Python references written from the spec before the RTL is read.
- artifacts
- The declared files each task must leave behind — what the gate checks and what this page cites.
- trace → dashboard
workflow/kimi_bridge.pytails the agent's wire log into trace events for a local live dashboard.
The datapath
One physical encoder layer, walked six times per sentence; int8 weights stream from DDR while int16 activations stay in fabric. Four blocks carry real defects the loop found.
◂ swipe to pan the diagram ▸
data flow control · prefetch heavy edge = layer reuse ×6 dashed outline = agent-drafted
spec/mirage.state.json and the W6–W11 reports; reusing one layer six times is what makes it fit. Target: Digilent Cora Z7-07S — 14,400 LUT · 66 DSP48E1 · 50 RAMB36, 512 MB DDR3, one 667 MHz Cortex-A9 (Digilent reference manual); budget per reports/w11-resource-map.md.All node notes (text version)
- ARM Cortex-A9 · PS
- Builds DMA descriptors and drives the tiling loop; runs the C driver, which has never run on a board.
- AXI DMA · HP0
- Streams int8 weights and activations. Post-optimization the pipeline is DDR-bound; crossover ≈192 MB/s vs the 100 MB/s planning assumption.
- DDR3
- All six layers of weights; ≈278 KB int8 per layer vs ≈1.11 MB fp32 — a 4× reduction.
- UART console
- Demo host; nothing has executed on silicon.
- token embedding
- int8, 256-dim, streamed from DDR.
- weight_stream_ctrl (drafted)
- Prefetches layer n+1 during compute — the W15 optimization: 25.98 → 16.74 ms.
- score BRAM · smx_cache (drafted)
- 128 × 21-bit entries; upstream file never existed; modelled drift 0 LSB.
- qkv_score_calc
- W1 audit: 21-bit score_sum overflows by exactly 1 at 2²⁰; testbench not self-checking.
- taylor_exp_approx
- Met its <1% bar only at x = 0; Q9 fix reaches 0.9683% max error.
- smx_core (drafted)
- As found 87–107 LSB from golden (scaling off ≈2¹⁸); fixed to worst 2.99 LSB, RMS 0.52.
- add & norm ①/②
- int8 inter-stage drifts past 1 LN unit by layer 1; int16 holds 0.0062 LN worst over 3 layers.
- ffn_core
- Failed 10/10 trials, did not compile, cannot fit its weights on-chip; closed with a redesign spec.
- output projection
- Vocabulary logits back to the PS; decode covered by golden models.
03 The loop
"Verify the softmax" is not a task — it cannot fail. "smx_core
matches the Python golden for 8 heads × 1 layer × 4 tokens" is a task. The loop
runs five verbs against 19 of those, one task at a time:
◂ swipe to pan the diagram ▸
harness/loop.py, workflow/query.py.# close a task whose declared report does not exist yet $ python -m workflow.cli complete p1/w3 --artifacts reports/w3-exp-error-histogram.md REFUSED p1/w3: acceptance not verified artifact missing: reports/w3-exp-error-histogram.md fix, or re-run with --force to override $ echo $? 2
Format as implemented in workflow/cli.py; --force was used zero times.
One iteration, end to end
Week 3, the exponential unit — from the run's own files. Stepping through lights the active path in the cycle above.
-
the harness picks the task
$ python -m workflow.cli next id: p1/w3 title: taylor_exp_approx acceptance: - Polynomial exp core within <1% relative error for |x| <= chosen clamp vs high-precision reference (error histogram produced).The state file chooses the task, never the agent's memory; replies cap at ~500 tokens.
-
golden model before RTL
outputs/taylor_exp_model.py — bit-accurate reference, written from the spec before the RTL is readSpec-first: the reference cannot inherit the RTL's mistakes.
-
the audit fails the RTL
As-coded RTL FAILS (clamp 0; 64/64 points ≥100% err)It met the bar at exactly one input, x = 0 — an implicit clamp swallowed the input (
spec/mirage.state.json). -
the documented fix
Q9 fix (S=512, clamp |x| ≤ 0.5352): max rel err 0.9683% — PASSRoot cause: Q-format. Two retries allowed; a third failure blocks the task (
reports/w3-exp-error-histogram.md). -
the gate reads the disk
$ python -m workflow.cli complete p1/w3 \ --artifacts outputs/taylor_exp_model.py reports/w3-exp-error-histogram.md p1/w3: done (verified=True)All 19 tasks closed this way;
--forcewas never used.
◂ swipe to pan ▸
The ledger — all 19 closures
From spec/mirage.state.json — the bar each task was held to and
the artifact it traces to.
P1 · Attention core — W1–W6
W1 qkv_score_calc finalization ✓
reports/w1-qkv-verification.mdW2 score_bram completion ✓
reports/w2-latency.mdW3 taylor_exp_approx ✓
reports/w3-exp-error-histogram.mdW4 smx_cache ✓
outputs/smx_cache.vhd · reports/w4-smx-cache.mdW5 smx_v_calc + smx_core ✓
outputs/smx_core.vhd · reports/w5-smx-e2e.mdW6 mha_core integration ✓
reports/w6-resource-latency.mdP2 · FFN & encoder — W7–W10
W7 FFN redesign at full dims ✓
reports/w7-ffn-verification.mdW8 Encoder layer integration ✓
reports/w8-encoder-layer.mdW9 Multi-layer scheduling ✓
reports/w9-multilayer.mdW10 Performance report v1 ✓
reports/perf-report-v1.mdP3 · Platform bring-up — W11–W12
W11 Synthesis and initial P&R ✓
reports/w11-resource-map.mdW12 Timing closure and bitstream v1 ✓
mirage_v1.bit explicitly not fabricated — pending a human Vivado run.artifact driver/mirage_driver.c · reports/w12-bitstream-timing-closure.mdP4 · End-to-end translation — W13–W14
W13 EN→AR greedy demo ✓
reports/demo-v0.mdW14 AR→EN bidirectional demo ✓
reports/perf-table-bidirectional.mdP5 · Optimization & beam — W15–W16
W15 Optimization pass ✓
reports/optimization-report-v1.mdW16 Beam search + evaluation draft ✓
reports/evaluation-report-draft.mdP6 · Hardening & release — W17–W19
W17 Hardening and robustness ✓
reports/robustness-matrix.mdW18 Final polish and pitch deck ✓
reports/pitch-deck-technical-appendix.mdW19 MVP freeze ✓
outputs/mirage_mvp_v1.0.md · reports/final-regression.log04 Results
What the audit found
Golden model first, RTL second kept finding real upstream defects — the project's strongest evidence:
| Module | As found | Root cause | After the loop |
|---|---|---|---|
taylor_exp | 64/64 sampled points ≥100% error; bar met only at x = 0 | implicit clamp swallowed the input (Q-format) | 0.9683% max error (Q9, |x| ≤ 0.5352) |
smx_core e2e | attention 87–107 int8 LSB from golden | exp input scaling off by ≈2¹⁸ | worst 2.99 LSB, RMS 0.52 |
ffn_core | 10/10 trials fail; won't compile; weights don't fit the device | no declaration for "mac_array"; 278 KB vs 225 KB BRAM | redesign spec — 16-bit activations, streamed weights |
| 6-layer stack | drift >1 LN unit by layer 1 | softmax chaotic under int8 inter-stage quantization | int16 inter-stage: 0.0062 LN worst over 3 layers |
The release gate is one command; the recorded v1.0 re-run, verbatim:
$ bash outputs/run_regression.sh
== model-level golden checks ==
PASS  taylor_exp_model.py
PASS  smx_e2e_model.py (2.99 < 4.0)
PASS  ffn_model.py
PASS  encoder_e2e_model.py (0.0296 < 0.05)
PASS  multilayer_e2e_model.py (0.0047 < 0.01)
PASS  greedy_decode_model.py
PASS  bidirectional_demo.py
PASS  beam_search_model.py (13 >= 13)
PASS  robustness_model.py
== RTL (ghdl) checks ==
PASS  ghdl:gemm_latency_tb
==
REGRESSION: ALL GREEN
exit=0
The numbers
19/19
tasks closed through the artifact gate, zero --force
state file
4
real defects found in the upstream RTL
reports W1–W9
2.99LSB
worst end-to-end attention error after fixes
golden model
16.74ms
6-layer sentence latency, overlapped streaming
cycle model @ 200 MHz
reports/w9-multilayer.md).reports/evaluation-report-draft.md §2).Evidence tiers & the spec's exit bar
ghdl-simulated
gemm tile 36/36 dot products, start→done measured at 1 clk. ffn_tb exits 0. All agent-drafted VHDL analyzes and elaborates clean.
Model-level golden
All accuracy claims — LSB drift, LN error, token-identical decode — come from bit-accurate Python models vs float references, not full-pipeline RTL sim.
Estimate / projection
Latency, throughput, the ≈1,700× comparison and the resource map are cycle-model or pre-synthesis figures. No board, no bitstream, nothing measured on silicon.
| Exit criterion | Standing | Status |
|---|---|---|
| EN→AR & AR→EN encoder translation | 10/10 token-identical vs golden — toy random weights; no trained checkpoint, no BLEU | model-level |
| ≥3× latency vs CPU baseline | cycle model clears it with margin; definitive int8-CPU comparison needs the checkpoint | modeled |
| <90% LUT & <95% BRAM, timing met | LUT 25%, BRAM 84% pre-synth; timing unmeasured; DSP 98% vs the task's <90% bar | pre-synth |
| Open-source repo + build/sim docs | regression script and per-week reports exist; LICENSE missing — owner decision, release blocker | blocked |
| Demo script + pitch deck | both exist; demo video and board run are human steps | done |
The loop held. Nineteen tasks closed, none forced, and the four upstream defects it found are the class of bug a skimming human misses and a golden model does not. What needed a board, a license, or a trained checkpoint it did not claim — the gate never let it. Next: Vivado synthesis and board bring-up, replacing every estimate above with a measurement.
05 Stack & my role
| Who | What |
|---|---|
| Built by me | The workflow engine (parse.py · model.py · query.py · cli.py), the artifact gate and retry/block policy, scope-guard hooks, the agent's system prompts, the trace bridge (kimi_bridge.py) and live dashboard wiring, and this page. |
| Produced by the agent (Kimi K3, inside the gates) |
Nine bit-accurate golden models, drafted RTL (smx_cache, smx_v_calc, smx_core, weight_stream_ctrl, rc2_hardening), the C driver, 19 task reports, and the one-command regression suite. |
| Upstream, read-only | The Mirage RTL, block diagram and model scripts. The agent could not write into it — enforced by hook, not etiquette. |
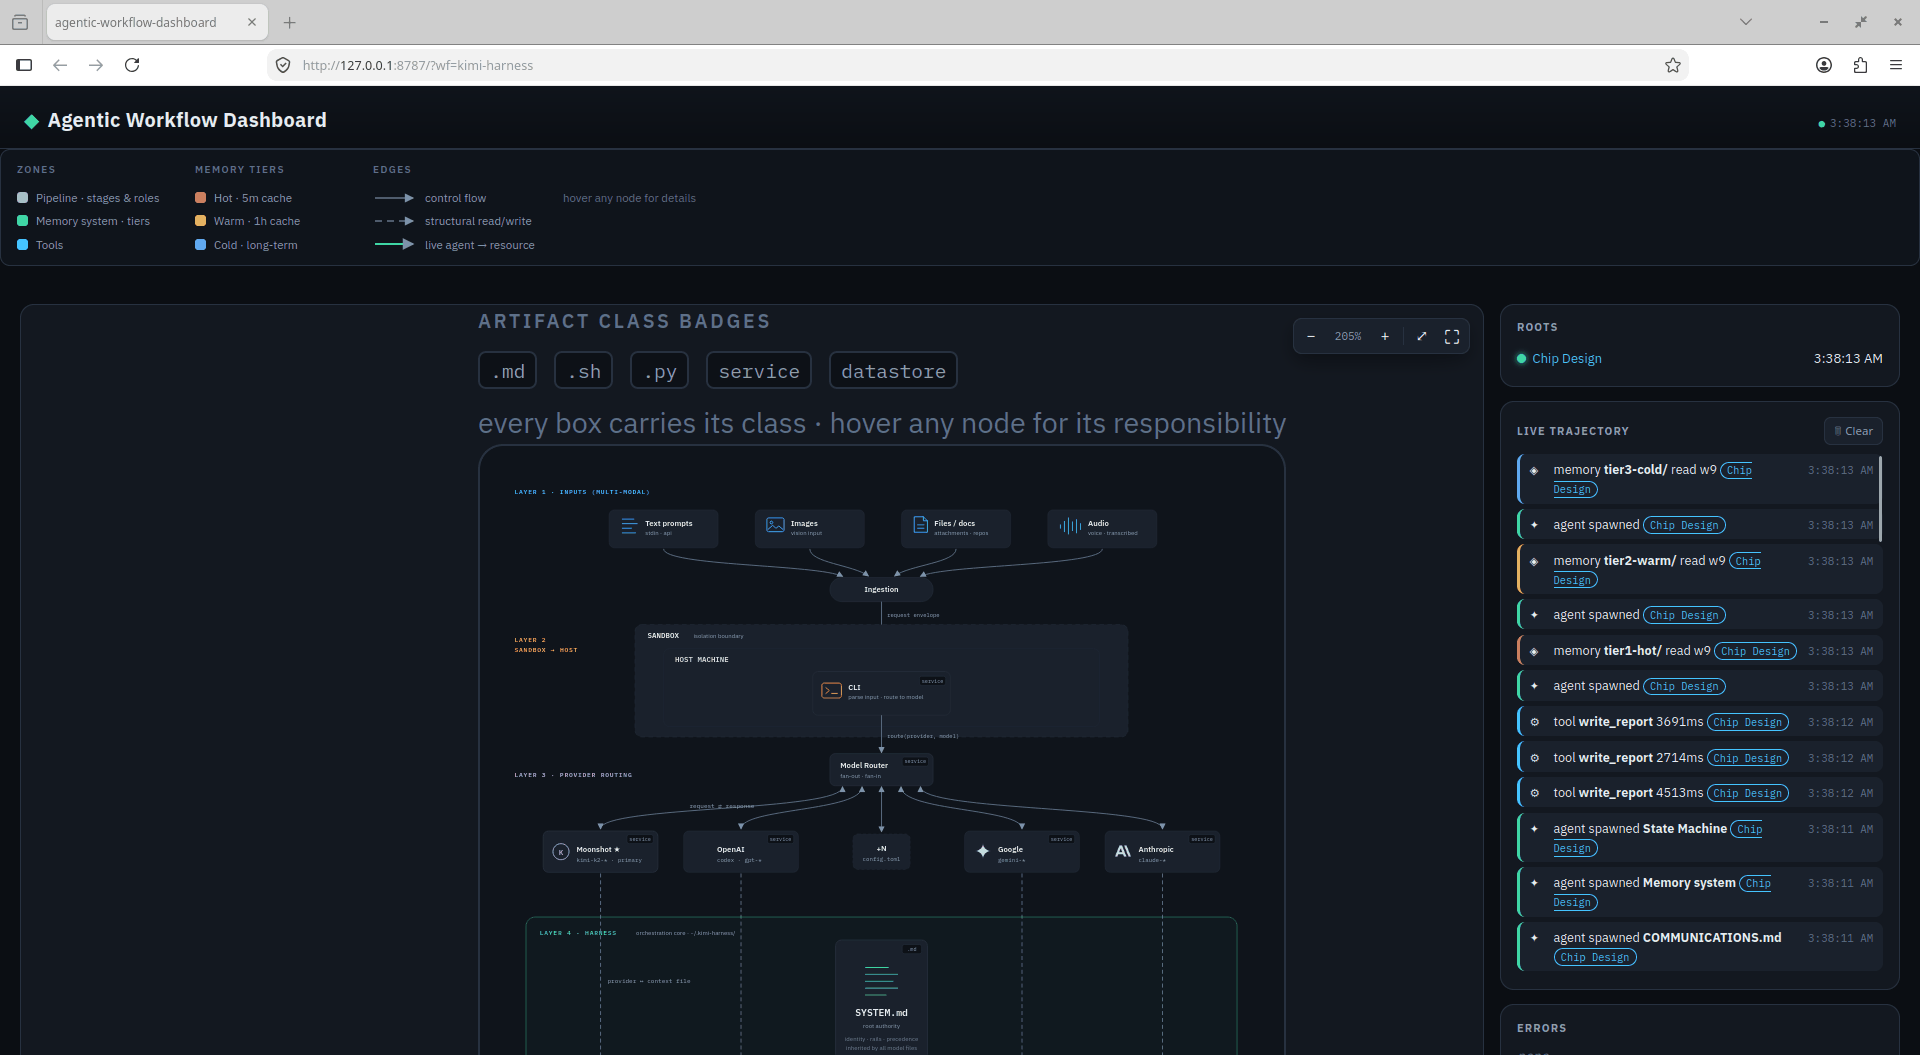
workflow/kimi_bridge.py, traces/*.jsonl).Stack: Python 3.11 stdlib · Kimi K3 via Kimi Code · ghdl 4.1 / VHDL-2008 · vanilla JS + inline SVG. No framework anywhere in the chain.